The annual report of the IPO , Facts and Figures, was published lately. They show the development of all registered rights throughout the last two years (2014 and 2015) partly in comparison to the past. Read our short overview to get to know the most important information.
Summary of All Registered Rights
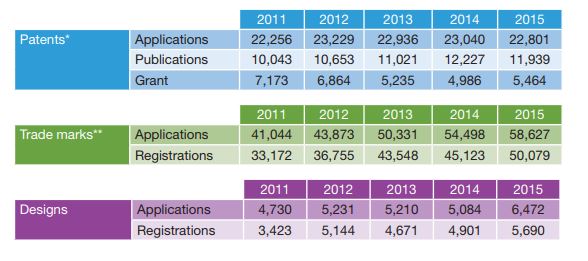
In general the patent applications and publications decreased a little bit from 2014 to 2015 while the trademark applications and registrations increased even more. More people applied or registered a design in 2015 than the year before.
Patents
Country of Residence
The following summary only refers to applications for UK patents.
As estimated the most applications filed, published as well as granted as patent were from the UK itself in both years (2014 and 2015). Followed with an apparent distance by the USA, Japan and Germany.
Only a half of all applications filed was published and not even a half of these were granted as patents. So in 2015 only a bit more than 5,000 patents out of 22.801 filed applications were granted.
International Patent Classification (IPC)
The most published applications were classified in the classes of instruments (C21 – C30) in 2014 and 2015 but most patents were granted for electricity. The least frequented class was Combinatorial Technology with less than four applications as well as granted patents per year.
Companies
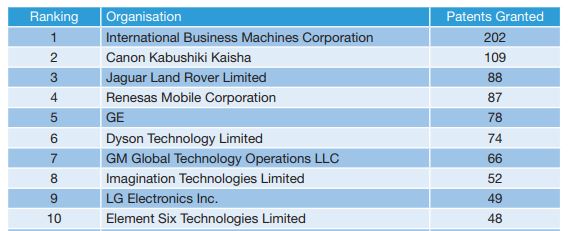
This table shows the top 10 companies who have had the most Patens Granted in any particular year.
Figures do not include European patents designating UK.
Renewal Fees
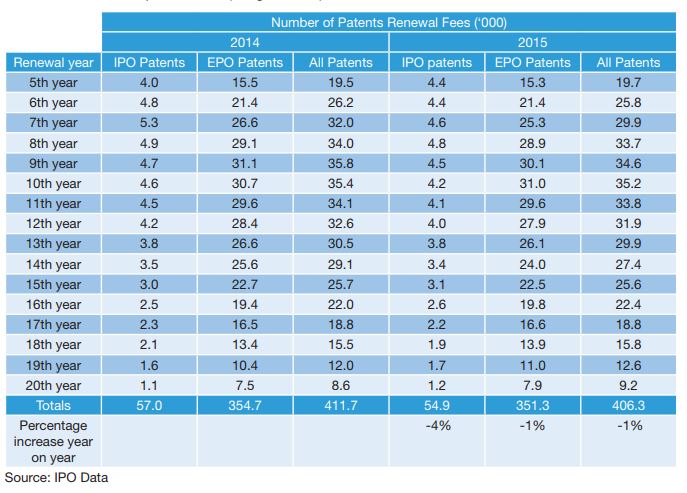
To maintain a granted patent’s rights it must be renewed every year by paying a fee the year ahead starting from the 4th anniversary of the filing date on the patent. These fees increase every year.
From the statistics we can see that there are way more patents renewed in the EPO than in the IPO, which was to expect because the EPO grants patents for every state of Europe while the IPO only grants patents for the UK.
Furthermore it is important to mention that the renewal decreases after sevento ten years. The differences between 2014 and 2015 are pretty small (1% less renewed patents in 2015).
Trade marks
Trade Mark Activity
The following summary is about national UK and international applications and registrations designating the UK.
The national applications and registrations are constantly increasing since 2011. Similar for the the international ones which increased 19% (applications) and 14% (registrations) from 2014 to 2015. In total applications and registrations are increasing every year since 2010. In 2015 there were 50.079 new trade marks registered.
Meanwhile the applications and registrations for classes are increasing as well, up to more than 104.000 registered classes in 2015.
Classification of Trade Marks for Goods and Services Published and Registered
In 2015 most newly registered national UK trade marks were classified in the class called “Advertising; business management; business administration, etc.” followed by “Education; entertainment; sporting and cultural applications”. International registrations designating the UK have mostly been protected for Class 9 “Scientific, nautical and surveying and electrical apparatus and instruments (including wireless etc)”, followed by “Advertising; business management; business administration, etc.”
Country of Residence
The most UK domestic registrations for trade marks and classes in 2015 were obviously by citizens of the United Kingdom followed by the Americans and the Chinese. In total there were more than 46,000 trade marks (10% increase compared to the year before) and nearly 97,000 classes registered (10% increase compared to the year before aswell).
The protected international registrations designating the UK increased 14% from 2014 to 2015. Also the number of protected international classes designating the UK increased a little bit in this time.
Companies
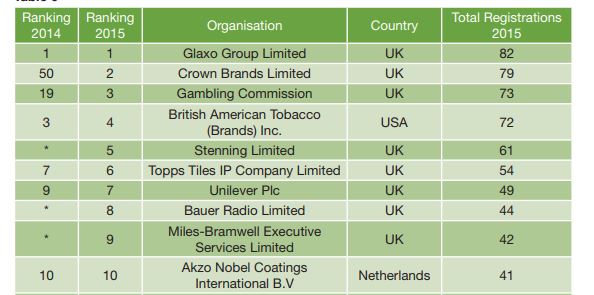
This table shows the top 10 companies who have had the most trade marks registered in 2014 and 2015.
Designs
Classifications of Goods
The most applications for designs in the UK were filed for the class “Clothing haberdashery” followed by “Furnishing” and “Games,/toys/sports goods”. In total there have been 6.457 applications filed in classes.
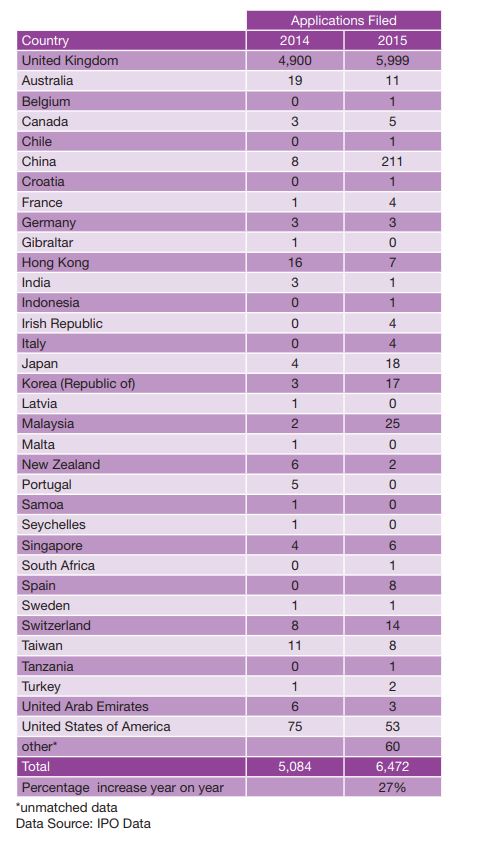
Country of Residence
Same as for patent and trade mark, the most applicants for a design at the IPO came from the United Kingdom. Next there comes China followed by the United States. The applications filed increased 27% from 2014 to 2015.
Designs Filed and Registered
Number of designs filed and registered during 2014 and 2015.
Source: IPO


Leave a Reply